Grafton Market Update April 2, 2026

🏡 Grafton, WI Market Update

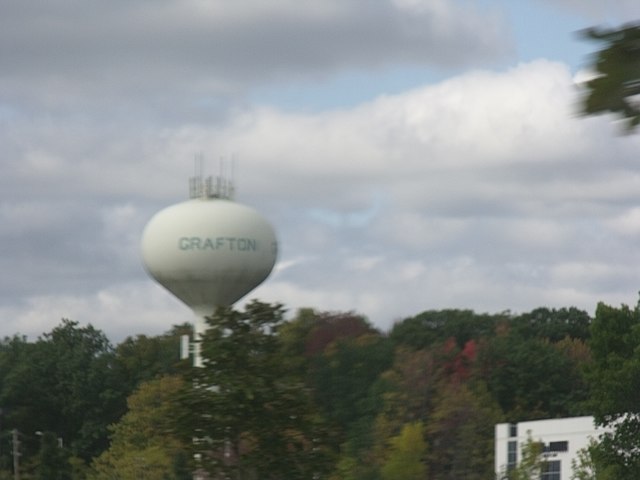
📸 Grafton Water Tower Photo by Corey Coyle (CC BY 3.0)

The Grafton market continues to show steady activity, with balanced inventory and consistent buyer engagement. Overall, conditions remain favorable for sellers who prepare their homes well.


📊 Market Activity

A total of 20 homes sold this period. At the same time, there were also 20 new listings added to the market.

While this keeps inventory levels relatively steady, overall supply remains low. Because of this, the market continues to favor sellers despite the balanced pace of new and sold listings.


💰 Home Prices

  • Average List Price: $654,857
  • Median List Price: $659,999
  • Average Sales Price: $562,986
  • Median Sales Price: $607,450

Overall, pricing remains relatively stable. However, the gap between list and sold prices suggests that outcomes can vary depending on pricing strategy and presentation. In other words, how a home is positioned still matters.


⏱️ Market Pace

  • Average Days on Market: 73 days
  • Sales Price to List Price Ratio: 103.95%

Homes are still selling for over asking on average. At the same time, the 73-day average shows that not every home is moving quickly.

Because of this, proper pricing and preparation are key. When a home is dialed in, it tends to attract stronger offers and move faster.


📦 Inventory Conditions

  • Active Listings: 45
  • Months of Supply: 2.25
  • Absorption Rate: 0.44

Inventory remains relatively tight. In fact, anything under 3 months of supply is typically considered a seller-leaning market.

Even so, conditions are not overly aggressive, which means buyers still have some room to evaluate options.


📐 Price per Square Foot

  • Average Price per Sq Ft: $238

While this provides a general reference point, price per square foot can vary significantly based on layout, condition, and location. Because of this, it’s best used as a broad guideline rather than a direct comparison between homes.


🌿 Home Flow Insight (For Sellers)

This week, focus on bedroom energy and reset.

Bedrooms should feel:

  • calm
  • open
  • restful

To begin, remove excess furniture, especially chairs, storage bins, or cluttered corners.
Next, keep nightstands simple with only essential items.
Then, use neutral, soft bedding to create a relaxed feel.
Finally, open curtains to allow natural light to move through the space.

👉 Ultimately, buyers don’t just see bedrooms—they feel whether the space allows them to rest. Because of this, a clean and grounded bedroom can elevate the entire home.


📍 Final Takeaway

Overall, Grafton continues to show steady demand with limited inventory. For that reason, sellers who prepare and price their homes thoughtfully are in a strong position.

This update reflects current Grafton, WI real estate trends, home prices, and housing market conditions.


📞 Let’s Connect

If you’re considering buying or selling in Grafton, or if you simply want a more personalized look at your home’s value, I’m here to help.

📱 Phone: 262.305.5704
📧 Email: dillon.reed@cbrealty.com
Cedarburg Market Update March 26, 2026

📊 Cedarburg Market Update – February 2026

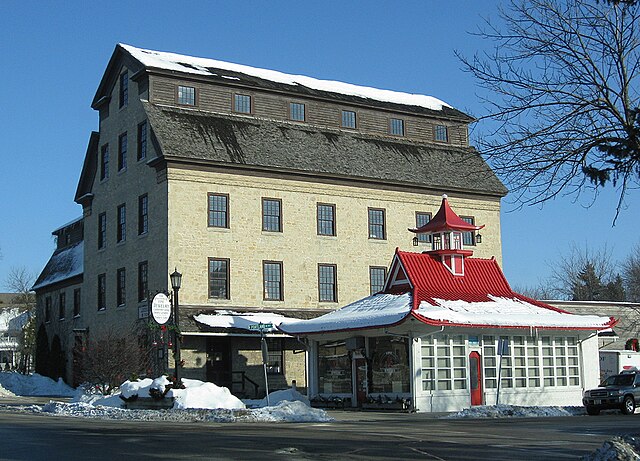
Photo credit: Freekee (public domain, via Wikimedia Commons)

The Cedarburg housing market remained highly competitive in February. As a result, strong buyer demand and limited inventory continue to shape conditions.


🏡 Market Activity

  • 9 homes sold in February

  • 11 new listings came to market

  • 15 total homes available

Notably, new listings slightly outpaced sales. Even so, inventory remains low overall. Because of this, buyers are still competing for a limited number of homes.


💰 Home Prices

  • Average List Price: $1,019,820

  • Median List Price: $849,900

  • Average Sales Price: $526,878

  • Median Sales Price: $499,900

  • Average Price per Sq Ft: $211

At the same time, there is a gap between list and sale prices. This reflects a mix of higher-end listings alongside stronger activity in more moderate price ranges.


Market Pace

  • Average Days on Market: 19 days

  • Sale-to-List Price Ratio: 102.35%

Overall, homes are selling quickly and often above asking price. This suggests buyers are willing to compete, especially when a home is priced well and shows well.

However, even in a fast market, preparation still matters. Homes that are well presented tend to attract the strongest interest early.


📦 Inventory Conditions

  • Months of Supply: 1.67

  • Absorption Rate: 0.60

Currently, inventory remains firmly in seller’s market territory. With less than two months of supply, conditions continue to favor sellers.

Even so, buyers are still selective. As a result, positioning a home correctly from the start remains important.


🌿 Home Flow Insight: Neutralize Colors to Broaden Appeal

Buyers need to picture themselves in a home. Because of this, bold or highly personalized colors can make that more difficult.

Before listing, consider:

  • Repainting bright or dark walls with neutral tones

  • Keeping finishes simple and cohesive

  • Reducing overly personal design choices

Ultimately, neutral spaces tend to feel larger, brighter, and more inviting. As a result, they appeal to a wider range of buyers.


📍 Curious About Local Home Values?

With inventory remaining limited in Cedarburg, some homeowners have been surprised by how much values have changed over the past few years.

If you’re curious about recent comparable sales or current pricing trends, I’m always happy to share additional local market data.

Overall, this report summarizes the latest housing data and real estate trends in Cedarburg, Wisconsin, helping buyers and sellers better understand current local housing market conditions.


Dillon Reed | Coldwell Banker Realty
📞 262.305.5704 | 📧 dillon.reed@cbrealty.com

Ozaukee County Market Update March 19, 2026

📊 Ozaukee County Market Update – February 2026

Photo credit: Kevin Hansen (CC BY-SA 3.0, via Wikimedia Commons)

The Ozaukee County housing market continues to show steady demand and tight inventory. As a result, homes are still moving efficiently, and sellers continue to maintain strong positioning.


🏡 Market Activity

  • 64 homes sold in February

  • 101 new listings came to market

  • 168 total homes available

Notably, new listings outpaced sales this month. Because of this, inventory may be starting to build slightly heading into spring. In turn, this could give buyers a bit more opportunity compared to earlier in the year.


💰 Home Prices

  • Average List Price: $728,467

  • Median List Price: $664,900

  • Average Sales Price: $504,864

  • Median Sales Price: $443,950

  • Average Price per Sq Ft: $230

At the same time, there remains a noticeable gap between list and sale prices. This often reflects a mix of higher-priced homes sitting longer, while mid-range properties continue to see stronger activity.


Market Pace

  • Average Days on Market: 50 days

  • Sale-to-List Price Ratio: 100.42%

Overall, homes are still selling at or slightly above asking price. This indicates that buyers are willing to compete when a home is priced well.

However, the 50-day average also suggests that not every home is moving instantly. Instead, pricing and presentation continue to play a key role in how quickly a property sells.


📦 Inventory Conditions

  • Months of Supply: 2.62

  • Absorption Rate: 0.38

Currently, inventory remains firmly in seller’s market territory (under 4–5 months supply).

Even so, compared to earlier conditions, this level suggests a slight easing rather than a major shift. As a result, buyers may begin to see more options and slightly less urgency. Meanwhile, sellers still hold the overall advantage.


🌿 Home Flow Insight: Declutter to Create Space

Buyers don’t just look at your home—they try to feel what it would be like to live in it. Because of this, one of the fastest ways to improve that feeling is simple:
👉 remove excess items from key living areas

For example:

  • Kitchen countertops (keep only essentials)

  • Living room surfaces (limit decor to a few intentional pieces)

  • Bathroom vanities (clear personal items)

Ultimately, the goal isn’t to make your home feel empty. Instead, it’s to make it feel open, clean, and easy to move through. When buyers can clearly see the space, they can better imagine their own life in it.


📍 Curious About Local Home Values?

With inventory remaining limited in Ozaukee County, some homeowners have been surprised by how much values have changed over the past few years.

If you’re curious about recent comparable sales or current pricing trends in the area, I’m always happy to share additional local market data.

Overall, this report summarizes the latest housing data and real estate trends in Ozaukee County, Wisconsin, helping buyers and sellers better understand current local housing market conditions.

Dillon Reed | Coldwell Banker Realty
📞 262.305.5704 | 📧 dillon.reed@cbrealty.com

Richfield Market Update March 12, 2026

Richfield Housing Market Update

View of the Kettle Moraine landscape from Holy Hill in Washington County, Wisconsin. Photo by Michael Barera (CC BY-SA 4.0).

Richfield, Wisconsin – Washington County Real Estate Market

Market Activity

The Richfield housing market remained steady during this reporting period. However, transaction volume is naturally lower here than in larger nearby communities.

  • New Listings: 4

  • Properties Sold: 5

Because Richfield has a smaller housing supply, even a few listings or sales can noticeably affect the local statistics.


Home Prices

Home values in Richfield continue to reflect the area’s mix of larger homes, acreage properties, and rural surroundings.

  • Average List Price: $684,711

  • Median List Price: $687,500

  • Average Sales Price: $526,501

  • Median Sales Price: $430,000

  • Average Sales Price per Square Foot: $313

However, prices can vary widely from month to month. This is because homes in Richfield often differ in size, acreage, and custom features.


Market Pace

Homes in Richfield are still selling at a healthy pace. In fact, properties are moving faster than many buyers might expect.

  • Average Days on Market: 30 days

  • Sale-to-List Price Ratio: 101.5%

As a result, well-priced homes continue to attract strong buyer interest. In many cases, sellers are still receiving offers at or slightly above the asking price.


Inventory Conditions

Inventory remains limited in Richfield. Currently, only a small number of homes are available for buyers.

  • Properties for Sale: 8

  • Months of Supply: 1.6

  • Absorption Rate: 0.62

Typically, a balanced housing market has about four to six months of inventory. Because Richfield currently has much less supply, conditions still lean toward a seller-favored market.


Home Seller Insight

Lighting is one detail many sellers overlook when preparing their home for photos and showings. Yet lighting can have a big impact on how a home feels to buyers.

Before listing, consider replacing older bulbs with warm LED lighting. Also, open curtains to let in as much natural light as possible. Brighter spaces usually photograph better online and can make rooms feel larger during showings.


Curious About Local Home Values?

With inventory remaining limited in Richfield, some homeowners have been surprised by how much values have changed over the past few years.

If you’re curious about recent comparable sales or current pricing trends in the area, I’m always happy to share additional local market data.


This report summarizes the latest housing data and real estate trends in Richfield, Wisconsin to help buyers and sellers better understand current local housing market conditions.

Grafton Market Update March 5, 2026

Grafton Housing Market Update – February 2026

Downtown Grafton, Wisconsin — Photo by Freekee via Wikimedia Commons (CC BY-SA 4.0)

February 2026

Here’s a quick look at how the Grafton housing market performed in February.


Market Activity

The Grafton market remained active through February, with 15 new listings coming to market and 13 homes closing during the month.

At the time of this report, 45 properties were actively listed for sale in Grafton, giving buyers a modest but growing selection of homes to consider.


Home Prices

Pricing in Grafton continues to show resilience.

  • Average List Price: $645,109

  • Median List Price: $668,900

  • Average Sale Price: $591,408

  • Median Sale Price: $564,575

On average, homes sold for 103.24% of their list price, showing that well-positioned listings can still attract strong offers.


Market Pace

Homes spent an average of 80 days on the market, suggesting that while some properties sell quickly, buyers are taking more time to evaluate options compared to the extremely fast pace seen in previous years.

The average sale price per square foot reached $240, reflecting continued demand for homes in the Grafton area.


Inventory Conditions

Inventory levels remain relatively balanced.

  • Active Listings: 45

  • Months of Supply: 3.46

  • Absorption Rate: 0.29

A balanced market typically falls between 4 and 6 months of supply, so Grafton continues to lean slightly toward a seller-favored environment, though buyers are beginning to see more choices appear.


Home Flow Insight

Last week we focused on the entrance of the home. This week, consider the pathways inside your space.

Take a moment to walk through your home and notice whether hallways or transitions between rooms feel open or crowded. Furniture, stacked items, or everyday clutter in these areas can interrupt the natural movement through a home.

Creating a little extra breathing room in these pathways can make a home feel calmer and more welcoming without making major changes.

Small adjustments in how a home flows often have a bigger impact than we expect.


What have you been noticing in the Grafton market lately? Does inventory feel like it’s opening up, or still tight from your perspective?

— Dillon Reed
Coldwell Banker Realty

Cedarburg Market Update February 26, 2026

Cedarburg, WI Real Estate Market Update – January 2026

The Cedarburg, WI real estate market remained inventory-constrained in January, with 15 active residential listings and 11 closed sales across single-family homes, condominiums, and townhomes. With just 1.36 months of supply, the market continues to reflect strong seller-leaning conditions.

Here’s a closer look at what the numbers show.


Current Inventory & Sales Activity

  • Active Listings: 15

  • New Listings: 10

  • Closed Sales: 11 (↑10%)

  • Months of Supply: 1.36 (↓20%)

  • Absorption Rate: 0.73

Inventory remains tight. A 1.36-month supply indicates that if no new homes were listed, current inventory would be absorbed quickly. This level of supply continues to support pricing stability and competitive positioning for well-prepared sellers.


Pricing Trends

  • Median Sale Price: $637,000

  • Average Sale Price: $614,000 (↓13%)

  • Median List Price: $800,000 (↑54%)

  • Average Price per Sq Ft: $275

  • Sale-to-List Price Ratio: 99.3% (↓2%)

While the median list price increased significantly month-over-month, this is likely influenced by higher-end inventory entering the market rather than broad-based price inflation. The median sale price remains solid, and homes are selling at nearly full asking price, suggesting alignment between buyer expectations and seller pricing.

The slight dip in average sale price reflects shifting sales mix rather than weakening demand.


Market Velocity

  • Average Days on Market: 23

Homes that are properly priced continue to move efficiently. An average of 23 days on market indicates steady buyer activity and decisive purchasing behavior, particularly given the limited inventory environment.


What This Means for Sellers

Low supply and strong sale-to-list ratios indicate that sellers who price strategically and prepare their homes well can still achieve competitive results. While the intensity of past peak years may have moderated, Cedarburg remains a supply-constrained market.

Presentation and pricing discipline remain critical.


What This Means for Buyers

With just over one month of supply, buyers continue to face limited options. However, days on market suggest that while decisions need to be timely, the environment is not chaotic.

Preparation, financing clarity, and realistic expectations remain key.


Outlook

Cedarburg continues to reflect modest seller advantage driven by constrained inventory and steady buyer demand. Unless inventory expands meaningfully, pricing support is likely to remain stable in the near term.


Home Flow Insight

The Entry Sets the Tone.
Buyers form their first emotional impression within seconds of walking through the front door. A clear, well-lit, and uncluttered entryway creates openness and calm.

In practical terms: remove excess furniture, ensure lighting is warm and functional, and keep sightlines open from the doorway into the home. Small adjustments at the entry often influence how the entire property feels.