Grafton Market Update June 11, 2026

Grafton Housing Market Update – May 2026

The Ozaukee Interurban Trail in Grafton, Wisconsin.
Photo: Freekee (Public Domain).

The Grafton housing market remained active throughout May. Buyer demand continued to absorb much of the available inventory. More homes have come to market this year than during the extremely limited conditions of recent years. However, inventory remains relatively tight and still favors sellers in many price ranges.

Through the first five months of 2026, 85 homes have sold in Grafton. The average sales price year to date is $570,996, while the median sales price is $578,565. During May alone, 23 homes sold. The average sales price for the month was $533,184, and the median sales price was $495,000.

Inventory remains one of the more notable aspects of the current market. Grafton had 51 active properties for sale during May. This resulted in 2.22 months of housing supply. Additionally, 23 new listings came to market during the month. That closely matched the 23 homes that sold.

As a result, buyers have more options than they did during the most competitive periods of the past few years. Even so, new inventory continues to be absorbed as it becomes available. This suggests that demand remains steady as we move into the summer market.

Home values have remained stable as well. The average list price during May was $621,790, while the median list price was $659,990. Meanwhile, homes sold for an average of 102.14% of their asking price. This indicates that buyers remain willing to compete for desirable properties despite affordability challenges and higher borrowing costs.

The average sales price per square foot reached $237 in May. Year-to-date sales have averaged $248 per square foot. Together, these figures point to continued strength in the local housing market.

Home Flow Insight

This week’s Home Flow Insight focuses on everyday functionality. Buyers are not only evaluating a home’s appearance. They are also imagining how daily life would feel in the space.

Before showings, take a look at areas such as mudrooms, laundry rooms, kitchen workspaces, and storage closets. Make sure these spaces feel organized and purposeful. When buyers can easily picture where they will place groceries, shoes, backpacks, and household essentials, the home often feels more practical and comfortable.

Whether you’re thinking about buying, selling, or simply staying informed about the local market, understanding current trends can help you make more confident real estate decisions.

If you’d like to discuss the Grafton market or learn what your home may be worth in today’s market, I’d be happy to help.

Dillon Reed
📞 262.305.5704
📧 dillon.reed@cbrealty.com

Grafton, Wisconsin housing market update for May 2026, including home prices, inventory levels, days on market, inventory trends, and local real estate market conditions.


Cedarburg Market Update June 4, 2026

Cedarburg Housing Market Update – May 2026

The historic Hilgen-Wittenberg Woolen Mill in Cedarburg. Photo by Kevin Hansen (Freekee), CC BY-SA 3.0.


The Cedarburg housing market remained active throughout May. Inventory continues to improve gradually, giving buyers a few more options than earlier in the year. Even so, well-priced homes are still attracting strong interest and, in many cases, selling above asking price.

Market Activity

Twenty homes sold during May, bringing the year-to-date total to 72 sales. At the same time, 22 new listings came to market. While inventory is increasing, demand continues to absorb available homes quickly.

Home Prices

Home values remained strong throughout May. The average sales price reached $602,968, while the median sales price came in at $555,000. Year-to-date, the average sales price stands at $611,108 and the median sales price is $574,380.

These numbers suggest buyers remain willing to compete for desirable homes, particularly those that are well-maintained and priced appropriately.

Market Pace

Homes spent an average of 35 days on the market during May, compared to the year-to-date average of 24.6 days. However, sellers continued to receive strong offers, as homes sold for an average of 103.2% of list price during the month.

Additionally, the average sales price per square foot increased to $277, reflecting continued buyer demand across the market.

Inventory Conditions

There were 35 homes available for sale during May, resulting in a 1.75-month supply of inventory. Although inventory levels have improved slightly, Cedarburg remains a seller’s market by historical standards.

As more homes come to market throughout the summer, buyers may gain additional opportunities. Nevertheless, properly prepared homes continue to stand out and attract attention.

Home Flow Insight

This month’s focus is on visual breathing room.

Before showings, try removing one item from every countertop, shelf, and tabletop in the home. Most sellers focus on removing clutter, but creating a little extra open space often has an even greater impact. Buyers tend to perceive rooms as larger, calmer, and more functional when there is room for the eye to rest.


These statistics provide a snapshot of housing activity and real estate trends in Cedarburg, Wisconsin for May 2026.

If you are curious about your home’s current value or have questions about buying or selling in Cedarburg, feel free to reach out.

Dillon Reed- Coldwell Banker Realty

Phone: 262.305.5704

Email: dillon.reed@cbrealty.com

Washington County Market Update May 28, 2026

Washington County Spring Market Update – 2026

Photo by Dave Hoefler on Unsplash
Taken in Wisconsin, USA — Published May 26, 2022
Captured with a Canon EOS 5D Mark IV
Used under the Unsplash License

Washington County’s housing market remained active this spring as buyer demand stayed strong across many price ranges. Inventory has improved slightly compared to earlier in the year, but well-priced homes are still moving quickly and attracting strong interest.

The average list price in Washington County reached $550,018, while the median list price came in at $449,950. Closed sales also stayed steady, with the average sales price rising to $434,025 and the median sales price reaching $408,000. These numbers continue to reflect healthy demand throughout the county.

One trend that stood out this season was how competitive the market remained even as more listings became available. Homes sold at an average of 100.65% of asking price, showing that buyers are still willing to compete for homes that are properly prepared and priced. Average days on market also dropped to just 31 days, which shows that desirable homes are continuing to sell at a healthy pace.

Inventory levels increased modestly during the month. Washington County had 244 new listings enter the market along with 294 active properties available. Even with that increase, the month’s supply of inventory remained low at 2.15 months, which still favors sellers overall.

Another encouraging sign has been the continued strength in price per square foot, which averaged $232. Buyers continue to place strong value on homes that feel clean, updated, and move-in ready as the spring market continues.

Home Flow Insight

As the weather warms up and windows begin opening more often, scent becomes an important part of the showing experience. Many sellers try to improve this with strong candles or air fresheners, but buyers often respond better to a home that simply feels naturally fresh and clean. Before showings, consider opening windows for a short period of time and keeping kitchens and laundry areas especially tidy. Natural airflow and light can help a home feel more comfortable and welcoming to buyers.

If you have questions about the Washington County market or are considering buying or selling this year, feel free to reach out anytime for a conversation.

Dillon Reed
📞 262.305.5704
📧 dillon.reed@cbrealty.com

This article is based on recent residential market data for Washington County, Wisconsin.

Richfield Market UpdateUncategorized May 21, 2026

Richfield Market Update – Spring 2026

Sunlight filtering through a quiet woodland trail in Wisconsin during summer.
Photo published July 17, 2020. Captured with an Olympus E-M1 Mark II.

The Richfield housing market remained highly competitive through April, with strong buyer demand continuing to put pressure on limited inventory. Homes that were priced well and presented cleanly moved quickly, while buyers remained willing to compete aggressively for desirable properties.

Year-to-date, the average list price in Richfield reached $657,354, while the April average came in at $601,556. Median list prices followed a similar pattern, with the year-to-date median at $624,949 and the April median at $524,950. These shifts reflect the variety of homes entering the market from month to month rather than a significant softening in demand.

Closed sales prices remained strong throughout April. The average sales price for the month climbed to $643,722, above the year-to-date average of $616,211. Median sales price also increased to $625,000 during April, showing continued strength in the upper end of the local market.

One of the clearest signs of buyer competition was the sales price-to-list price ratio. On average, homes sold for 104.35% of asking price during April, indicating that multiple-offer situations remained active across many price points. In addition, the average days on market dropped sharply to just 12 days for the month, compared to the year-to-date average of 28.75 days.

Inventory levels continued to remain tight. Richfield had only 14 homes available for sale in April, along with 14 new listings entering the market. Month’s supply of inventory rose slightly to 1.56 months, but the market still remains firmly in seller-friendly territory.

Average sales price per square foot came in at $212 during April. While this was lower than the year-to-date average of $258, monthly fluctuations in price per square foot can vary depending on the size, age, and style of homes sold during a given period.

Home Flow Insight

As buyers continue moving quickly through homes this spring, one of the most overlooked staging details is creating a sense of openness and flow between rooms. Buyers tend to respond strongly to homes that feel easy to move through both physically and visually.

Simple adjustments such as removing extra furniture, widening walking paths, and clearing crowded corners can make rooms feel larger and more comfortable without spending significant money. Even small changes in layout can help buyers feel more relaxed as they move through the home, which often leaves a stronger overall impression during showings.

This continues to be especially important in a competitive market where buyers are touring multiple homes in a short period of time.


Dillon Reed
Coldwell Banker Realty

Phone: 262.305.5704
Email: dillon.reed@cbrealty.com

This Spring 2026 update reflects current housing trends in the Richfield, Wisconsin real estate market.

Grafton Market Update May 14, 2026

Grafton, WI Real Estate Market Update – April 2026

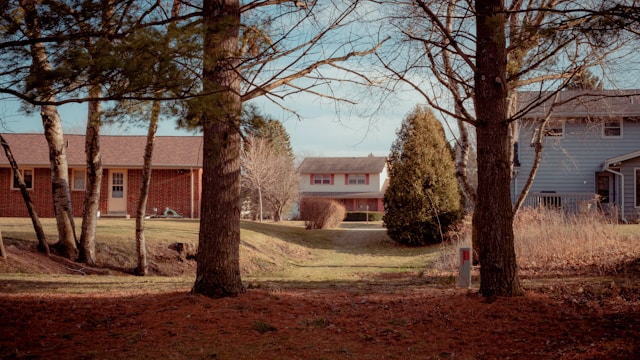
Photo: Suburban Wisconsin neighborhood
Published April 2, 2020
Captured with SONY ILCE-7R
Used under the Unsplash License

The Grafton housing market remained active through April. Buyer demand stayed steady, and pricing continued to hold strong across many parts of the market. Inventory is slowly improving, but conditions still favor sellers overall.

Year-to-date, the average list price in Grafton reached $661,925. The April average came in slightly lower at $646,403. Median list price figures showed a similar trend. The year-to-date median list price was $673,600, while the April median was $659,999.

Closed sales prices also remained strong during April. The average sales price rose to $591,761 for the month compared to the year-to-date average of $580,449. The median sales price increased to $618,750 in April. These numbers suggest buyers are still willing to compete for desirable homes in the area.

Homes continued to sell close to or above asking price. In April, sellers received an average of 101.17% of list price. This points to continued competition for well-maintained and properly priced homes. In addition, the average sales price per square foot increased to $264 in April, compared to the year-to-date average of $251.

Inventory levels improved slightly during the month. Grafton had 53 homes available for sale in April, along with 36 new listings entering the market. Month’s supply of inventory rose to 3.31 months. While this is an improvement, the market still remains below balanced conditions.

Homes spent an average of 99 days on market during April. However, market pace can vary depending on pricing, updates, and presentation. Homes that are clean, updated, and move-in ready continue to attract the strongest interest from buyers.

Home Flow Insight

As spring continues, outdoor presentation becomes more important. Buyers are paying closer attention to yards, patios, and outdoor gathering spaces this time of year. Fresh mulch, trimmed landscaping, swept walkways, and simple seating areas can help a property feel welcoming before buyers even step inside.

Small outdoor improvements can also help buyers picture themselves enjoying the home during the warmer months ahead.


Dillon Reed
Coldwell Banker Realty

Phone: ____________________
Email: ____________________

This April 2026 update reflects current housing trends in the Grafton, Wisconsin real estate market.

Cedarburg Market Update May 7, 2026

Cedarburg Market Update – April Snapshot

Cedarburg, WI | Photo by MikeM1958 (Canon EOS Rebel T6s) | August 5, 2018

The Cedarburg market remains strong, though we are starting to see a bit more balance as spring unfolds. The average list price came in at $857,159 in April, slightly below the year-to-date average of $891,847. This suggests sellers are still confident, but are beginning to price more in line with what buyers are willing to pay in today’s market.

Sale prices continue to hold steady, with the average at $597,193 in April and the median at $567,000. While list prices remain higher overall, homes that are priced appropriately and presented well are still closing at solid values. The sales-to-list price ratio held above 101%, which shows buyers are still willing to compete when a home is positioned correctly.

At the same time, the pace of the market has slowed slightly. Average days on market increased to 23 in April, up from 19 year-to-date. While still a relatively quick turnaround, this shift suggests buyers are taking a bit more time to evaluate their options, especially as more homes become available.

Inventory is beginning to build, with 32 homes for sale in April and a monthly supply of 2.29 months. This is still firmly in seller’s market territory, but it does give buyers more choice than earlier in the year. New listings and a slightly lower absorption rate point toward a market that is gradually moving toward a more balanced pace, even as demand remains steady.


Home Flow Insight – Let the Home Feel Open

This week, focus on how the home feels when someone moves through it.

Walk your home as if you were a buyer. Notice if anything slows you down—chairs in walkways, tight corners, or rooms that feel crowded. Even small adjustments, like shifting furniture a few inches or removing one piece entirely, can make a space feel more open and easy to move through.

Buyers don’t always say it directly, but they respond to how a home flows. When movement feels natural and effortless, the home feels larger and more comfortable overall, which can leave a stronger impression during showings.


Bottom Line

The Cedarburg market remains active, with strong demand for well-priced homes. As inventory continues to increase slightly, pricing and presentation are becoming even more important in attracting serious buyers.

This update reflects April housing trends and pricing activity in Cedarburg, Wisconsin.


Dillon Reed
📞 262.305.5704
📧 dillon.reed@cbrealty.com


Ozaukee County Market Update April 30, 2026

Ozaukee County Early Spring Market Update

Green Bay Road Historic District in Thiensville — a locally recognized historic area within Ozaukee County. Photo: Freekee/Kevin Hansen (Public Domain), May 30, 2009.

As we wrap up April, I wanted to share a quick look at how the Ozaukee County market performed in March—and what that’s telling us as we move into the heart of the spring market.

What’s happening with activity
We saw 96 homes sell in March, bringing the year-to-date total to 217. At the same time, new listings are starting to pick up, with 107 homes hitting the market in March. As we typically see this time of year, more options are coming online, but not enough yet to fully balance things out.

What about prices?
Prices are holding steady and showing strength. In March, the median sale price came in at $511,500, with the average at $580,088. On the list side, the median stayed right around $669,900. Overall, there’s no sign of price softening at this point.

How fast are homes moving?
Things sped up in March. Specifically, average days on market dropped to 34 days, down from 45 year-to-date. At the same time, homes are selling for about 102% of asking price. In other words, buyers are still stepping up and competing when the right home comes along.

What does inventory look like?
There were 165 homes available in March, with about 1.7 months of inventory. In simple terms, that’s still a seller-leaning market. Even though more homes are coming on, demand is keeping things relatively tight.


Home Flow Insight

This week, I want to highlight something simple that often gets overlooked—quiet and stillness during a showing.

When buyers walk through a home, they’re not just looking—they’re feeling the space. However, constant background noise can break that connection.

Before showings, take a few minutes to:

  • Turn off TVs, loud fans, or music
  • Let the home feel calm and settled
  • Check smoke and carbon monoxide detectors to make sure batteries aren’t low

While it may seem small, a home that feels quiet and put together allows buyers to slow down, focus, and more easily picture themselves living there.

Dillon Reed | Coldwell Banker Realty
📞 262.305.5704
📧 dillon.reed@cbrealty.com

Mequon Market Update April 23, 2026

Mequon Market Update – Spring 2026

Photo: Mequon, WI, USA — via Unsplash (published August 23, 2023)

Here’s a look at how the Mequon market is performing, both year-to-date and through the month of March.


Market Activity

The Mequon market remains active, though with a more measured pace compared to surrounding areas.

So far this year, 62 properties have sold, with 30 of those closing in March alone. At the same time, 90 new listings have come to market year-to-date, including 23 in March.

Overall, inventory remains limited, and each new listing carries more weight in shaping market movement. This means that well-prepared homes have a strong opportunity to attract attention as they come to market.


Home Prices

Pricing continues to hold at higher levels, with some variability month to month.

Currently, the average list price sits at $1,008,408 year-to-date, rising to $1,074,285 in March. Meanwhile, the median list price increased to $864,900 from $821,627 year-to-date.

On the sold side, the average sales price came in at $707,572 year-to-date and $699,731 in March. At the same time, the median sales price saw a dip from $643,333 to $575,000.

Taken together, this reflects a market where pricing remains strong overall, while individual sales can vary depending on property type, condition, and positioning. Month-to-month shifts like this are common in a smaller, higher-end market like Mequon, where individual sales can influence averages more significantly.


Market Pace

Homes are moving efficiently, with buyers continuing to act decisively on well-positioned properties.

On average, days on market decreased from 35 year-to-date to 30 in March. At the same time, homes are selling at or above asking price.

In fact, the sale-to-list price ratio reached 101.27% in March, up from 99.61% year-to-date. As a result, buyers are continuing to act quickly when the right opportunity presents itself, particularly when homes are priced and presented with intention.


Inventory Conditions

Inventory remains tight, particularly at higher price points.

At present, there are 119 active listings year-to-date, with 43 available in March. Meanwhile, months supply of inventory dropped from 2.06 to 1.43.

In addition, the absorption rate increased from 0.51 to 0.70, showing that buyers are moving through available homes at a faster pace. Even with some new inventory entering the market, conditions still favor sellers due to the limited overall supply.


Price per Square Foot

Price per square foot continues to trend upward, reinforcing overall value.

Currently, the average sits at $249 year-to-date and $251 in March. In other words, buyers remain willing to pay a premium for homes that are well-located and well-prepared. This reinforces the importance of presentation, especially in a market where expectations are higher.


Home Flow Insight 🌿 – Scent & Air Quality

In a market like Mequon, buyers are paying attention to more than what they see—they’re also responding to what they sense the moment they walk in.

To start, focus on fresh, neutral air. Open windows when possible and allow the home to breathe naturally before showings.

Next, be mindful of lingering odors. Cooking smells, pets, or heavy fragrances can shift a buyer’s experience quickly. Instead of masking scents, aim to remove them entirely.

At the same time, avoid strong candles or plug-ins. What feels pleasant to one person can feel overwhelming to another.

Ultimately, a home that feels clean and neutral allows buyers to relax and settle in more easily.
And when the air feels right, the entire space becomes more inviting without needing anything extra.


This update reflects March 2026 housing trends in Mequon, highlighting strong pricing, efficient market pace, and limited inventory conditions as we move further into the spring market.


If you’re thinking about buying or selling in Mequon, I’m always available to talk through your situation and help you make sense of the current market.

Dillon Reed
📞 [262.305.5704]
📧 [dillon.reed@cbrealty.com]

Washington County Market Update April 16, 2026

Washington County Market Update – March 2026

Pike Lake in Hartford, WI. Photo by NaturesFan1226, used under Creative Commons Attribution 3.0.

Market Activity

The Washington County market continues to show steady activity as we move through early spring.

So far this year, buyers have purchased 270 properties, and in March alone, they closed on 124 homes. At the same time, sellers brought 436 new listings to market year-to-date, with 186 of those hitting the market in March.

Overall, buyers continue to absorb new listings quickly, which keeps supply relatively tight.


Home Prices

Home prices continue to hold steady, with only minor shifts from month to month.

Currently, sellers list homes at an average of $541,593 year-to-date, while March came in slightly lower at $533,732. Meanwhile, the median list price rose to $449,900 in March compared to $443,233 year-to-date.

On the sold side, buyers paid an average of $423,207 year-to-date and $424,068 in March. Similarly, the median sales price dipped slightly from $396,817 year-to-date to $392,000 in March.

Taken together, buyers and sellers remain closely aligned on pricing expectations.


Market Pace

Homes continue to move at a steady pace, even with a slight shift in March.

On average, homes spent 39 days on the market year-to-date, while March extended that timeline to 44 days. However, sellers still receive offers very close to their asking price.

In fact, buyers paid 99.41% of list price year-to-date and 99.99% in March. As a result, sellers who price correctly continue to capture nearly full value.


Inventory Conditions

Inventory remains below balanced levels, although early signs of movement are starting to show.

Right now, the market holds 752 active listings year-to-date, with 305 available in March. At the same time, inventory sits at 2.86 months year-to-date and 2.46 months for March.

Meanwhile, buyers increased the pace of purchases, pushing the absorption rate from 0.35 year-to-date to 0.41 in March.

Even so, a balanced market typically falls between 4–6 months of inventory. Because of this, sellers still hold the advantage in most situations.


Price per Square Foot

Price per square foot continues to show consistency across the market.

Currently, buyers pay an average of $227 per square foot year-to-date and $225 in March. In other words, home values continue to hold steady without major swings.


Home Flow Insight 🌿 – Furniture Placement & Flow

Once you declutter and clean a home, the next step is shaping how the space feels as buyers move through it.

In many cases, furniture placement either opens a space up or closes it off.

To start, create clear walking paths through each room so buyers can move naturally. Then, avoid pushing all furniture against the walls, as that often makes a room feel smaller.

Instead, arrange furniture in a way that defines each space while keeping the layout open. As a result, rooms feel more functional and easier to understand.

Ultimately, buyers don’t just evaluate finishes—they ask themselves, “Can I live here comfortably?”
And when the flow works, the home answers that question on its own.


This update reflects March 2026 housing trends in Washington County, highlighting steady pricing, consistent demand, and low inventory conditions as we move into the spring market.

Richfield Market Update April 9, 2026

Richfield Market Update – March 2026

Published June 22, 2022
Nikon COOLPIX L820 · Unsplash License

The Richfield housing market showed steady activity in March. At the same time, when compared to the year so far, there are early signs of a slight shift in pace. Inventory has increased modestly, while buyers appear to be taking a bit more time in their decision-making.


Market Activity

So far in 2026, 24 homes have sold, with 11 of those sales occurring in March alone. In addition, 18 new listings came to market this month, contributing to a total of 29 new listings year-to-date.

This tells us that while activity remains consistent, March accounted for a meaningful portion of the year’s movement, suggesting a gradual buildup as we move into the spring season.


Home Prices

  • Average List Price: $691,897 (YTD) → $643,284 (March)
  • Median List Price: $664,098 (YTD) → $589,900 (March)
  • Average Sales Price: $606,341 (YTD) → $584,809 (March)
  • Median Sales Price: $597,667 (YTD) → $654,500 (March)

Pricing trends present a mixed but informative picture. While both average and median list prices came in lower during March compared to the year-to-date figures, the median sales price increased noticeably.

This suggests that although some homes are entering the market at more moderate price points, well-positioned properties are still achieving strong results. In other words, demand remains present for homes that are priced and presented effectively.


Market Pace

  • Average Days on Market: 35 (YTD) → 43 (March)
  • Sales Price to List Price Ratio: 100.33% (YTD) → 100.97% (March)

Homes are still selling at or slightly above asking price. However, the increase in average days on market—from 35 days year-to-date to 43 days in March—indicates a more measured pace.

So while buyers are continuing to compete on desirable homes, they are also taking more time to evaluate their options compared to earlier in the year.


Inventory Conditions

  • Active Listings: 32 (YTD) → 19 (March)
  • Months of Supply: 1.27 (YTD) → 1.73 (March)
  • Absorption Rate: 0.85 (YTD) → 0.58 (March)

Inventory remains low overall, but there has been a slight increase in available supply during March. As a result, the months of supply rose from 1.27 to 1.73, giving buyers a bit more breathing room.

At the same time, the absorption rate has slowed, which reinforces the idea that while homes are still selling, they are not moving quite as quickly as earlier in the year.


Home Flow Insight 🌿

As the market begins to balance slightly, how your home feels is becoming increasingly important.

First, create clear and open pathways throughout the home. When buyers can move easily from space to space, the home naturally feels larger and more inviting.

Next, simplify each room. Rather than filling a space, focus on defining it. This helps buyers understand how they might live in the home.

Finally, bring in as much natural light as possible. Open blinds, clean windows, and use soft lighting where needed. A bright, open environment creates a stronger emotional connection.

When a home flows well, buyers tend to stay longer—and that often leads to stronger offers.


Let’s Connect

If you’re thinking about buying or selling in Richfield, or simply want a clearer understanding of your options, I’m here to help.

Dillon Reed
📞 262.305.5704
📧 dillon.reed@cbrealty.com


This March update reflects evolving conditions in the Richfield, WI real estate market, with steady demand, slightly increased inventory, and a more measured pace compared to earlier in 2026.